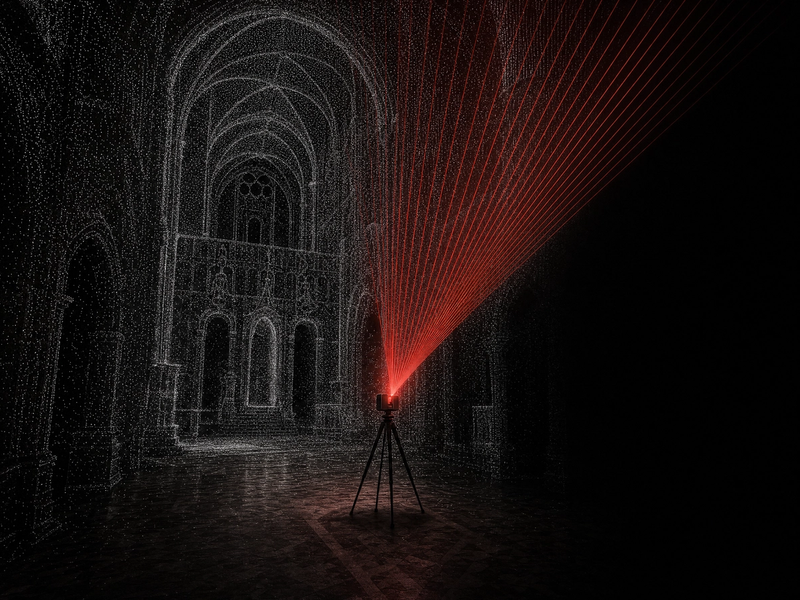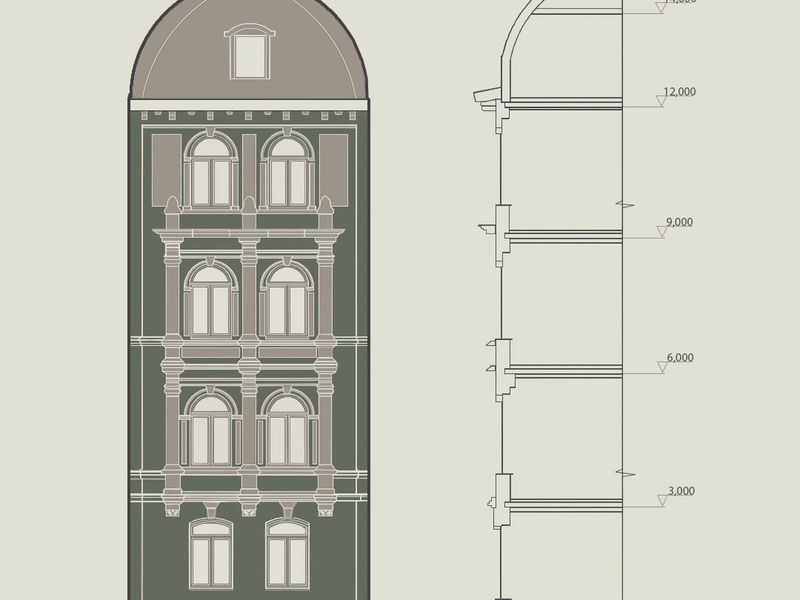
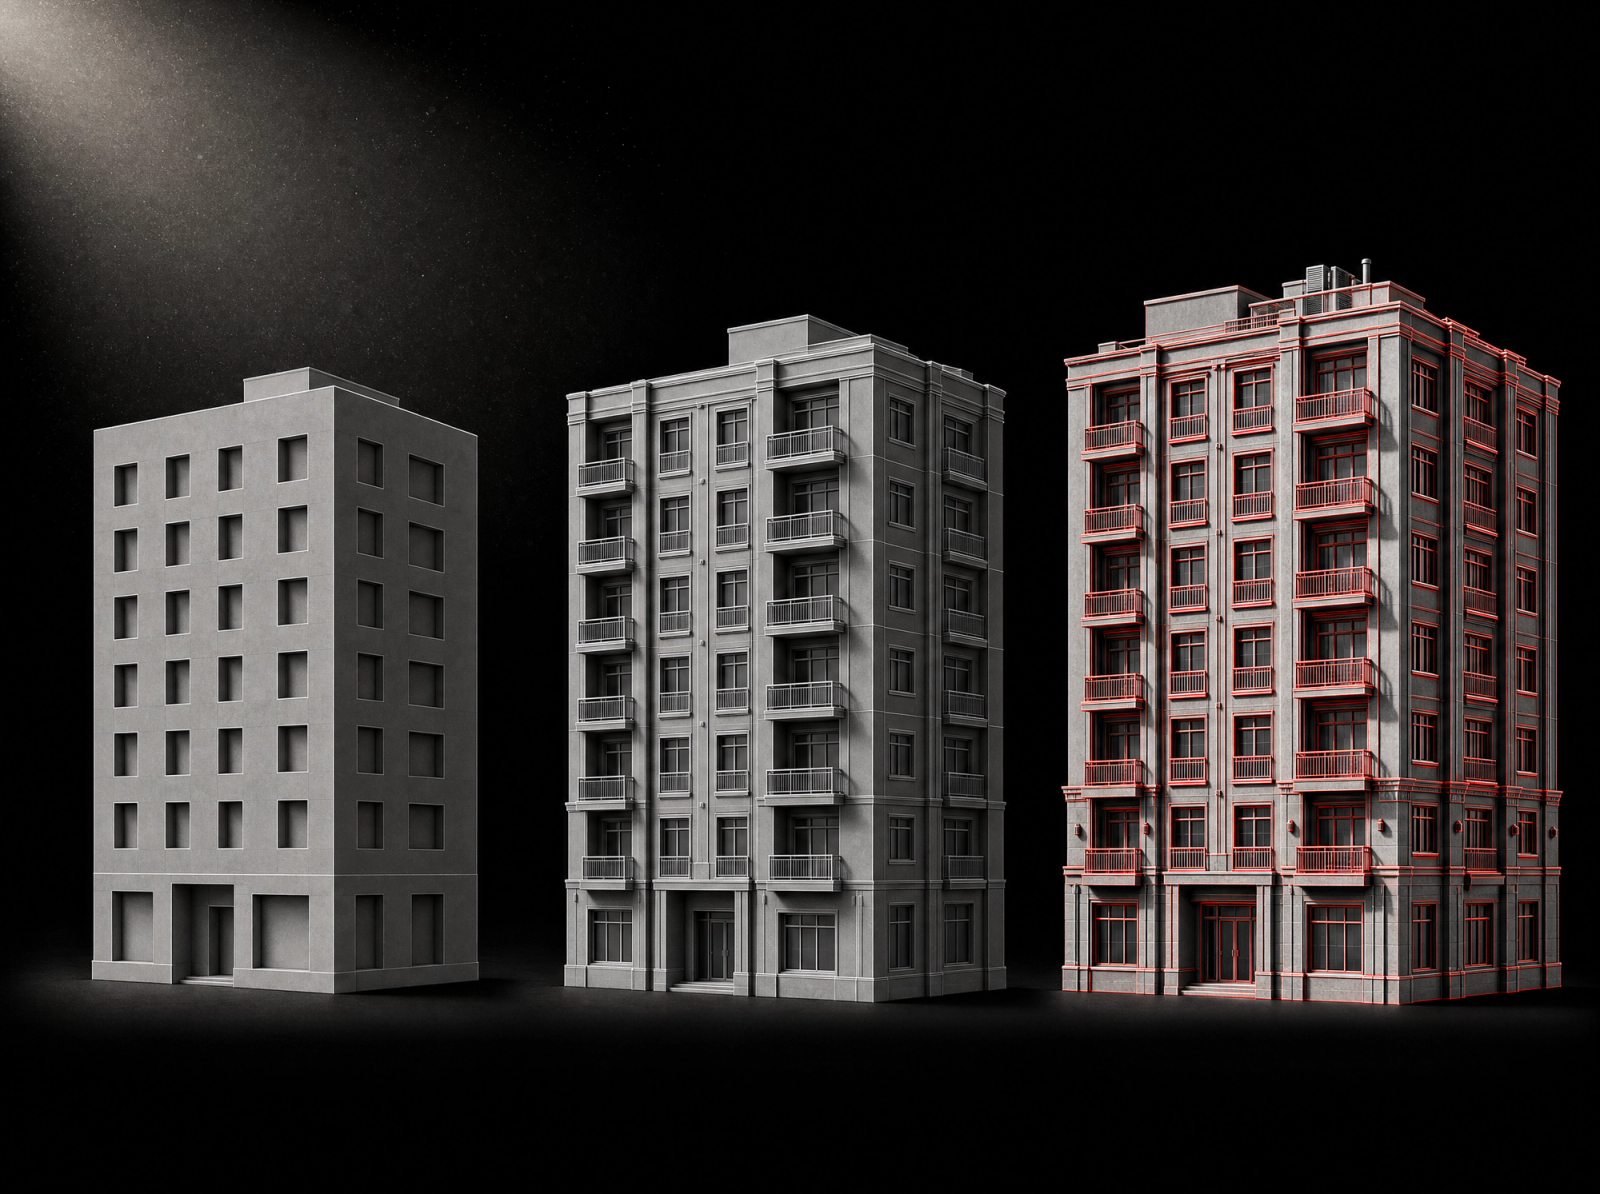
Everyone selling Scan to BIM has an answer to this question. Almost nobody publishes it. The honest answer is that the cost of a Scan to BIM project is the hours it takes multiplied by the rate of whoever does the work. So instead of the usual it-depends answer, here are the hour ranges our projects fall into, calculated from 35 completed Scan to BIM projects.
Why hours, not euros
Rates differ from team to team and market to market, so a price in euros tells you about the vendor. Hours tell you about the work. If you are comparing bureaus, ask each one how many hours your building will take. The answers are directly comparable, and you can check them against the tables below.
One scope note: these ranges cover modelling only, starting from a registered point cloud. Laser scanning and point cloud registration are separate work and are not included.
The full package: architecture, structure and MEP
Hour ranges per model for the complete set of disciplines. The lower bound is a typical building without complications; the upper bound is complex geometry, dense saturation or higher detailing requirements.
| Building size | LOD 200 | LOD 300–350 | LOD 400 |
|---|---|---|---|
| Small (under 2,500 m²) | 75–180 h | 105–240 h | 230–540 h |
| Medium (2,500–6,000 m²) | 175–400 h | 240–550 h | 530–1,200 h |
| Large (6,000–15,000 m²) | 290–650 h | 390–900 h | 850–2,000 h |
| Very large (over 15,000 m²) | 775–1,800 h | 1,050–2,400 h | 2,300–5,350 h |
Architecture and structure only
| Building size | LOD 200 | LOD 300–350 | LOD 400 |
|---|---|---|---|
| Small (under 2,500 m²) | 45–100 h | 60–140 h | 140–320 h |
| Medium (2,500–6,000 m²) | 100–240 h | 140–320 h | 310–725 h |
| Large (6,000–15,000 m²) | 170–390 h | 230–525 h | 500–1,150 h |
| Very large (over 15,000 m²) | 450–1,050 h | 625–1,400 h | 1,350–3,150 h |
MEP only
| Building size | LOD 200 | LOD 300–350 | LOD 400 |
|---|---|---|---|
| Small (under 2,500 m²) | 40–95 h | 55–130 h | 125–285 h |
| Medium (2,500–6,000 m²) | 95–215 h | 125–290 h | 280–650 h |
| Large (6,000–15,000 m²) | 150–350 h | 205–475 h | 455–1,050 h |
| Very large (over 15,000 m²) | 400–950 h | 550–1,275 h | 1,200–2,850 h |
How these ranges were built
The base figures are medians of actual hours across the 35 projects, grouped by floor-area band. Detailing multiplies the base: LOD 300–350 runs at about ×1.35 of LOD 200, and LOD 400 at about ×3.0. Disciplines scale it again: architecture and structure at ×1.0, MEP at ×0.9, and the full package at ×1.7. Note the LOD 400 factor: going from LOD 200 to LOD 400 roughly triples the work. The useful question is not what the highest possible LOD is, but what LOD this model actually needs.
What pushes a project to the top of the range
Three things, in the order we meet them. Geometry: a heritage facade or a building where nothing repeats takes multiples of what a regular grid takes. The tables absorb most of this, but an extreme case can exceed them. Saturation: a plant room with layered services is not the same work per square metre as an empty hall, which is also why MEP carries its own table. And the scan itself: occlusions, noise and gaps in the point cloud mean assumptions, and assumptions mean either rework later or a conversation now. If a cloud is not fit for the scope you are asking about, we flag the problem zones and recalculate the scope around them instead of quoting around the gaps.
Where these numbers come from
We have been doing Scan to BIM since 2021: 180–200 delivered projects and somewhere between 620,000 and 700,000 m² of existing buildings modelled. The smallest was a 100 m² building in Ringsheim, Germany; the largest, a 69,000 m² Alstom plant and the 49,000 m² University of Bonn. In between: residential, offices, hospitals, heritage, schools, industrial facilities, hotels and infrastructure. The clouds arrive from Faro, Leica RTC360 and BLK360, NavVis VLX, Matterport and Trimble hardware; the models leave in Revit 2020–2026. Every project to date has been delivered within the agreed deadline.
What is the price of a Scan to BIM project?
Take the range for your building size, discipline set and LOD, and multiply by an hourly rate. That is the whole budget conversation on one page. For a number instead of a range, the calculator gives an estimate in a minute.
Or skip the arithmetic: send us the point cloud and what the model is for, and you will have a fixed quote and a delivery date within 24 hours. What the service includes, tolerances and LOD definitions are on the Scan to BIM service page.